Fibonacci Retracement Strategy Levels Explained With Series
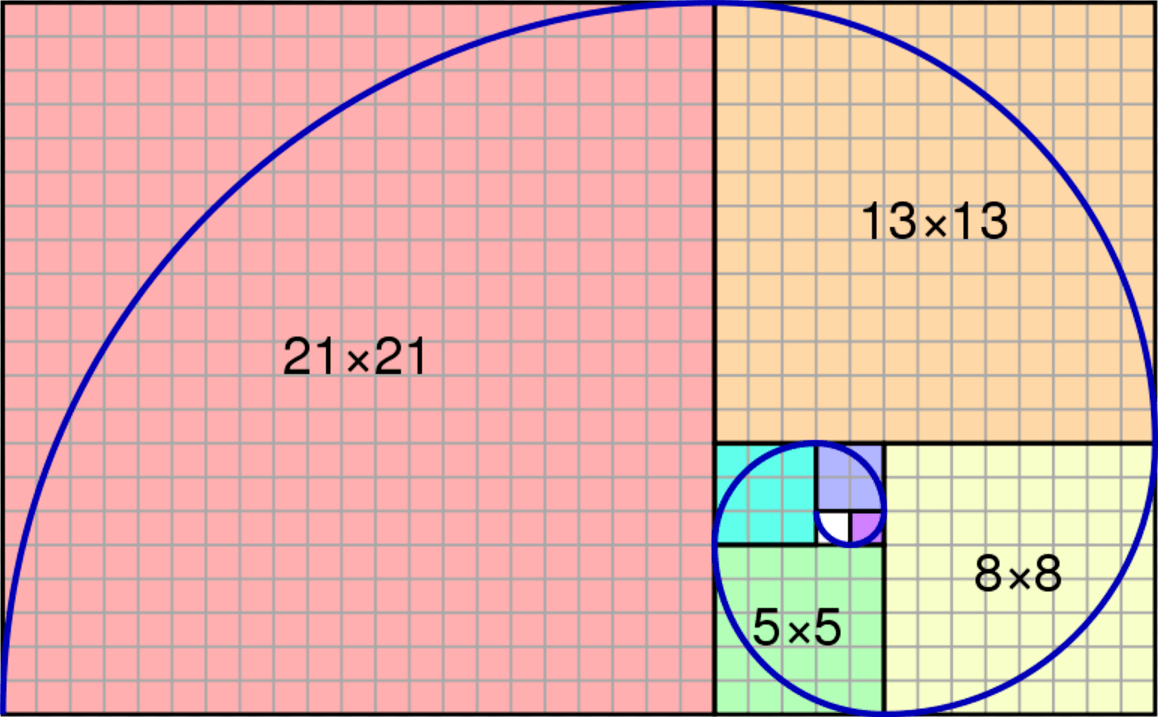
Fibonacci Retracement Levels Explained With Series
The Fibonacci retracement levels starts from 0 to 100 values. Visit our youtube channel we explained about Fibonacci Retracement Strategy in Tamil In our .The major retracement levels start with 0%, 23.6%, 38.2%, 50%, and 61.8% the final bottom levels are 100%. Fibonacci is not an indicator. It is a most popular tool to draw a high and low between any two significant price points. In order to use the Fibonacci retracement levels as a profitable tool. You need to find the proper high and lows. It could be a recent high or recent low. We explained of How to Draw Fibonacci Retracement Levels in Tamil in our YouTube channel. The Fibonacci retracement tools are easy to use in charting. But the difficulty here is, if you’re high and low points are wrong then you would be in bad position. Fibonacci retracement levels are proven to be good tool. If the traders understand the tool they can make a consistent profit in future market.

Our YouTube video about Fibonacci Retracement Strategy in Tamil will be a best guide for tamil known people. This article will helps to know more about Fibonacci Retracement Strategy By Golden Ratio, fibo Levels, Fibo Numbers On Chart. Experienced traders use they own experience in market to find a proper high and lows to draw a Fibonacci points. But for new traders it is hard to do that. Because without knowing the trend of the market it is not possible. So we Suggest the traders to use Trend Indicator and that would help then to find the proper high and low. In contrast of using other indicators we are using Rsi Indicator to find a trend. Hope the following article about the Fibonacci Retracement points will help you.
How To Draw Fibonacci Retracement On Chart
Fibonacci tool are used by most successful day traders in future and stock trading. The tool helps the traders to find a proper retracement point to make a successful entry levels. Due to misunderstand of price action there is more possibilities for traders to draw a wrong Fibonacci levels. So finally we are in the stage to learn of How to draw Fibonacci retracement on chart. Therefore follow the steps given below rather than to skip the article.
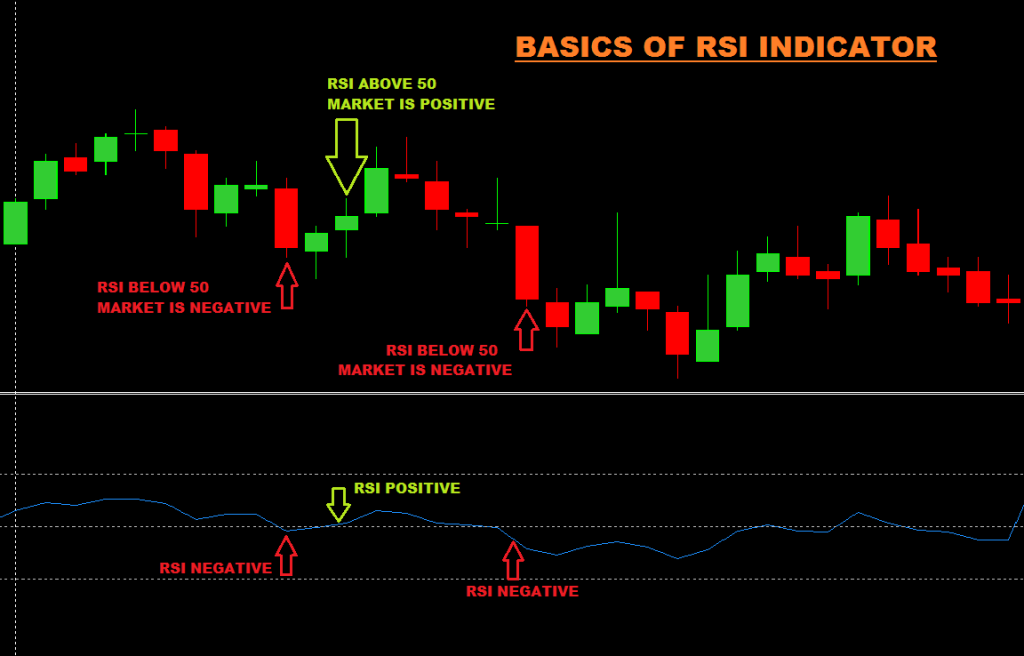
- First we need a trend finding indicator to use with Fibonacci.
- Here we use the RSI indicator to use with Fibonacci.
- If Rsi value is above 50 then we consider the Market is Positive.
- If Rsi value is below 50 then we consider the Market is Negative.
- The image shown below will give some idea about the strategy.
Basics of Fibonacci Retracement Tool
Here we are going to see about the Fibonacci retracement Levels. And we are going to watch of where we should use that. This tool is found in all charting platforms. The main advantage of that tool is it gives the chance of best entry points. We can point the Fibonacci Levels from Any swing points. If we Place a Fibo levels in wrong swings then we would face some loss. So, pointing the 100% levels and 0% levels are more important. So let us see of where to use the Fibonacci levels.
Using Fibonacci Retracement With Rsi Strategy
Now we come to the final part of the article. Mean we are going to see the trading strategy on Fibonacci retracement. We are going to use the RSI indicator with Fibonacci tool. Follow the steps below with image.
- Point the Fibonacci 100% on higher high of RSI 50.
- And place the Fibo 0% level on lower low of RSI 50.
- Now wait for Market to Retrace for 50% Fibonacci Levels with a Continuation Of RSI Below 50.
- Once this condition happen, the market means us it is in sell trend. So we should be ready to make a sell in the market.
- The question here is where to make a sell? Kindly watch Image 2 given below to know the answer.
Image 1 : Shows the Basics of where to draw a Fibonacci retracement levels
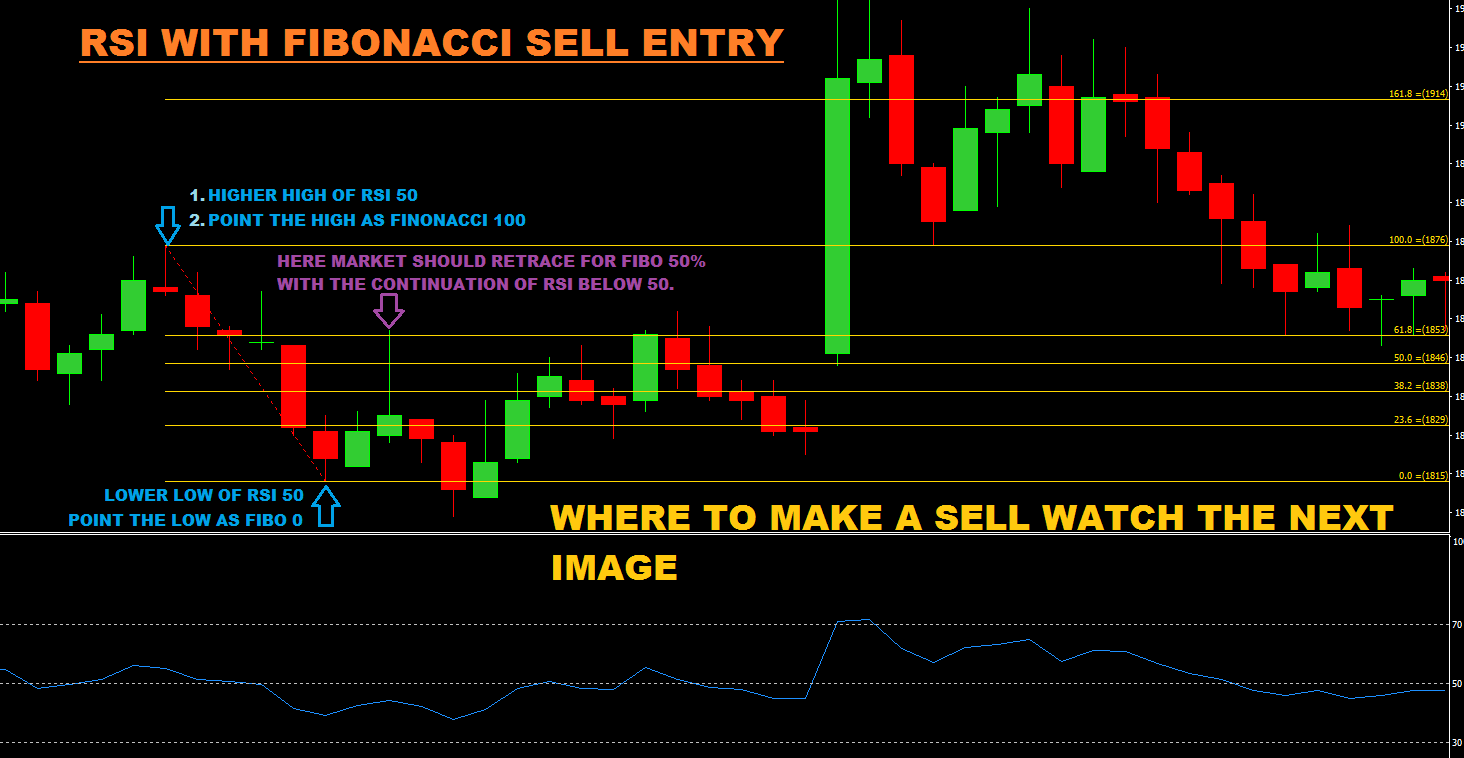
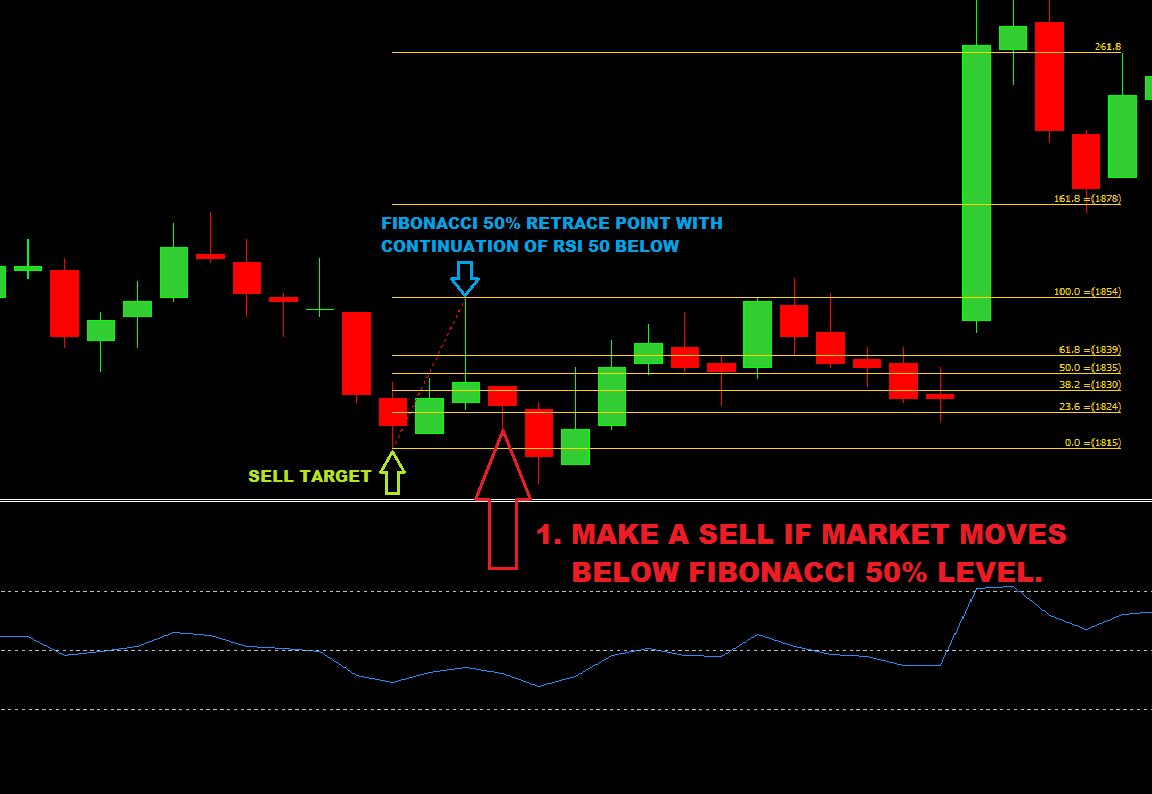
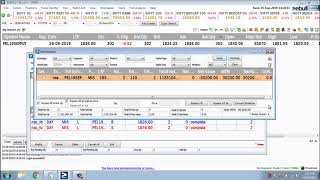
Image 2 : Shows the Basics of where to make a SELL Entry
- Now replace the Fibonacci 100% from top to Fibo 50% retracement high.
- Make a SELL if market Cross the Fibonacci 50% Level. Mean make a sell If Market Cross 1835 price.
Conclusion of Fibonacci Retracement Chart Levels
Finally we are in the conclusion of the article. Now let’s see what we covered in the above article. We covered of how to Create Strategy Using Fibonacci retracement levels in Tamil. How to use Fibonacci retracement levels? likewise Best time frame for Fibonacci retracement. If you like to know about the Fibonacci retracement YouTube video can visit the YouTube channel. As a result of the above article now the traders could know Fibonacci retrace meaning and intraday trading using Fibonacci retracement points.
Would you like to know about how to trade with Fibonacci retracement and extensions? Read this article it will help you. There are some common words in Fibonacci. Fibonacci retracement numbers, Fibonacci retracement chart. Similarly Fibonacci retracement golden ratio and Fibonacci series are almost the same words. This above words comes under the answer of 50% retracement levels. Finally we are in the Conclusion, about Fibonacci Retracement Strategy By Golden Ratio fibo Levels Fibo Numbers On Chart in tamil. all the best to make a profitable Fibonacci futures trading & Fibonacci stock trading.
90% Accuracy Forex Strategy Live Trading
RS.30,000 PROFIT MADE WITH SMALL STOPLOSS
Be Patience Learn the Movement


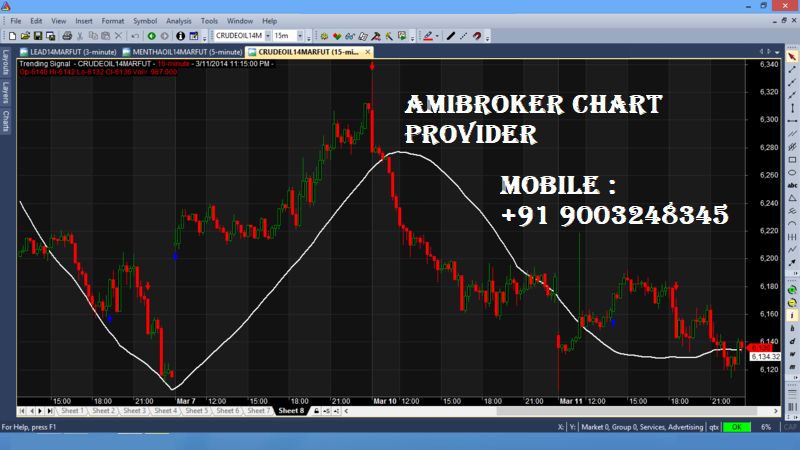
Amibroker Data Chart in Tamil Nadu
Amibroker Data Chart in Tamil Nadu
We are the best Amibroker chart provider in Tamil nadu for mcx commodity & Nse cash future. Meanwhile before trying the Amibroker chart try our mt4 demo chart. We provide 7 days Mcx commodity & NSE future stock demo for Amibroker.
Know The Rules To Trade The Indicators
Welcome To Chidhucommodity Blog
We Provide a Right Technical Knowledge About the Mcx Crudeoil, Nse stock and future market & Forex Market In India From Tamil Nadu.