Forex Hedging Strategy EA In Tamil

Forex Hedging Strategy In Tamil
Forex Hedging Strategy Guaranteed Profit
The above video are explained about the Forex Hedging Strategy in Tamil. Trading forex market and making Profit in it are big dream for all forex traders. But only few traders have succeeded in it. Mean only 10% of forex traders are succeed in it. Balance 90% for traders are finding hard to find a proper entry points to make a profitable trade. forex hedging strategy guaranteed profit method are not possible for all forex traders. Because the hedging are more risk in trading without the proper knowledge. We teach a forex trading strategy in tamil and English make a use of it. 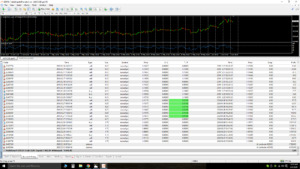
Who can make a trade in forex using hedging method ?
- The trader who have a proper knowledge about the market turning point.
- Who can analyse the trend reversal.
- And the traders who have sufficient fund to reinvest in market
If the forex traders have the above criteria can trade in forex with hedging strategy.
The forex or the future traders always search for strategy that works always in profit. the truth behind is, it is not always possible to make a profit in market. Even now few traders dont know the meaning of hedging, they search for forex buy and sell at the same time strategy. The great quote of Warren buffet , Rule 1 : Don’t lose the money & don’t forget the rule 1. This quote was misunderstood by forex and future traders. Since they dont want to lose money they use the hedging in forex market. And finally they search for answer of how to hedge a losing forex trade? and how to get out of hedge forex? can visit our youtube channel to know about the youtube forex trading strategies in tamil. Finally we are in conclusion of the article Trade with Stop loss.
Fibonacci Retracement Strategy Levels Explained With Series
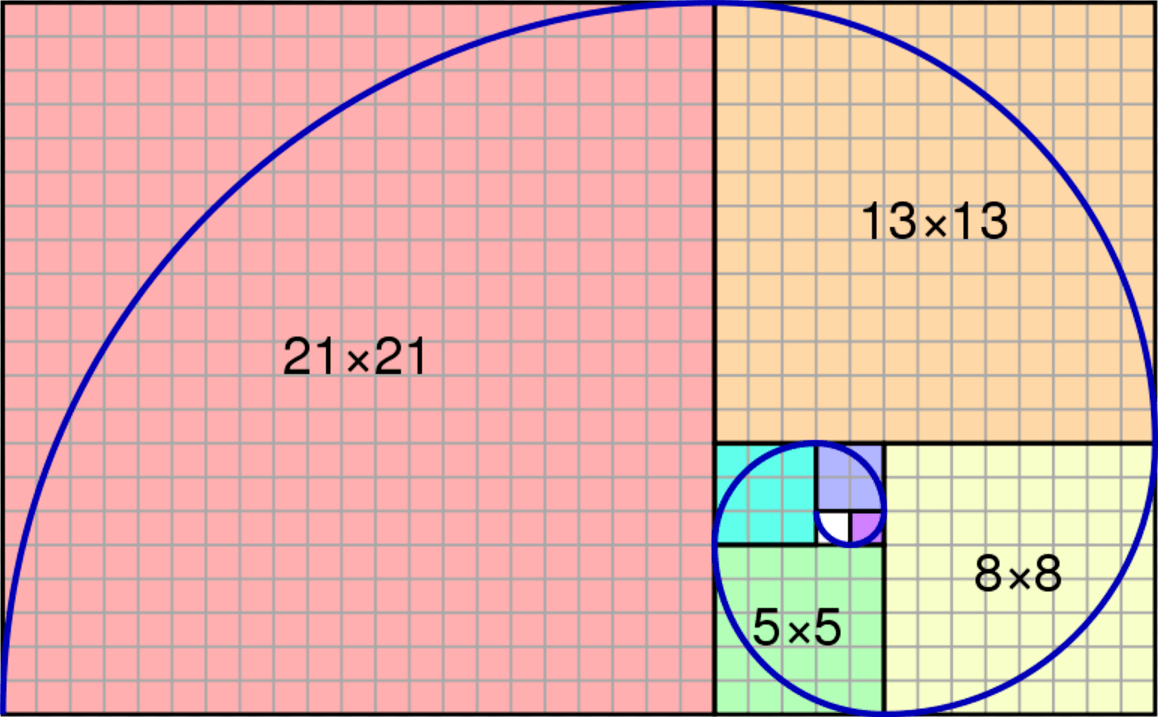
Fibonacci Retracement Levels Explained With Series
The Fibonacci retracement levels starts from 0 to 100 values. Visit our youtube channel we explained about Fibonacci Retracement Strategy in Tamil In our .The major retracement levels start with 0%, 23.6%, 38.2%, 50%, and 61.8% the final bottom levels are 100%. Fibonacci is not an indicator. It is a most popular tool to draw a high and low between any two significant price points. In order to use the Fibonacci retracement levels as a profitable tool. You need to find the proper high and lows. It could be a recent high or recent low. We explained of How to Draw Fibonacci Retracement Levels in Tamil in our YouTube channel. The Fibonacci retracement tools are easy to use in charting. But the difficulty here is, if you’re high and low points are wrong then you would be in bad position. Fibonacci retracement levels are proven to be good tool. If the traders understand the tool they can make a consistent profit in future market.

Our YouTube video about Fibonacci Retracement Strategy in Tamil will be a best guide for tamil known people. This article will helps to know more about Fibonacci Retracement Strategy By Golden Ratio, fibo Levels, Fibo Numbers On Chart. Experienced traders use they own experience in market to find a proper high and lows to draw a Fibonacci points. But for new traders it is hard to do that. Because without knowing the trend of the market it is not possible. So we Suggest the traders to use Trend Indicator and that would help then to find the proper high and low. In contrast of using other indicators we are using Rsi Indicator to find a trend. Hope the following article about the Fibonacci Retracement points will help you.
How To Draw Fibonacci Retracement On Chart
Fibonacci tool are used by most successful day traders in future and stock trading. The tool helps the traders to find a proper retracement point to make a successful entry levels. Due to misunderstand of price action there is more possibilities for traders to draw a wrong Fibonacci levels. So finally we are in the stage to learn of How to draw Fibonacci retracement on chart. Therefore follow the steps given below rather than to skip the article.
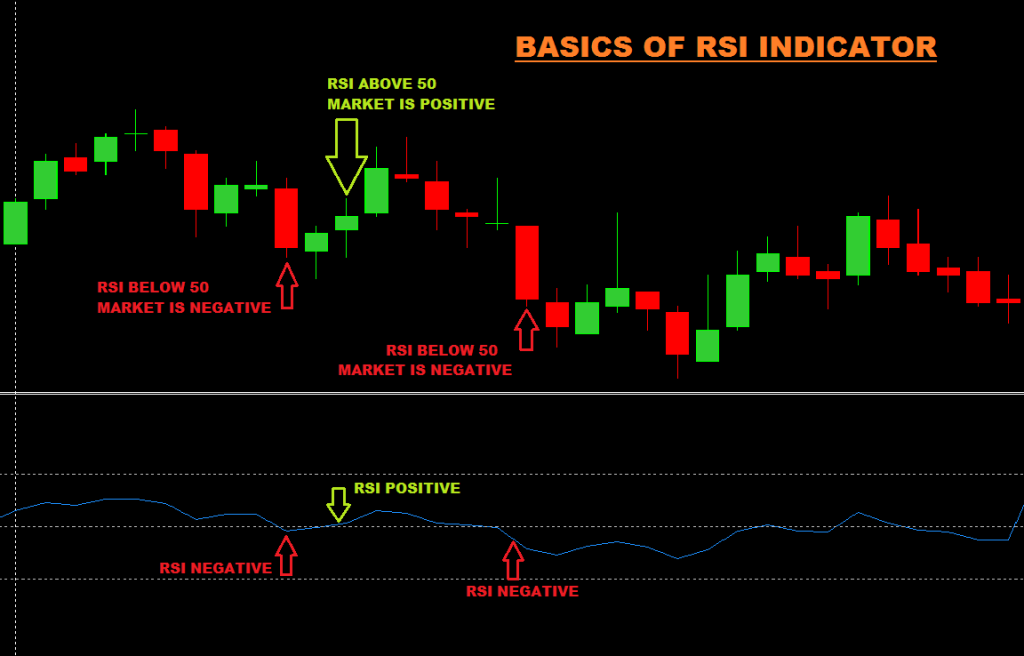
- First we need a trend finding indicator to use with Fibonacci.
- Here we use the RSI indicator to use with Fibonacci.
- If Rsi value is above 50 then we consider the Market is Positive.
- If Rsi value is below 50 then we consider the Market is Negative.
- The image shown below will give some idea about the strategy.
Basics of Fibonacci Retracement Tool
Here we are going to see about the Fibonacci retracement Levels. And we are going to watch of where we should use that. This tool is found in all charting platforms. The main advantage of that tool is it gives the chance of best entry points. We can point the Fibonacci Levels from Any swing points. If we Place a Fibo levels in wrong swings then we would face some loss. So, pointing the 100% levels and 0% levels are more important. So let us see of where to use the Fibonacci levels.
Using Fibonacci Retracement With Rsi Strategy
Now we come to the final part of the article. Mean we are going to see the trading strategy on Fibonacci retracement. We are going to use the RSI indicator with Fibonacci tool. Follow the steps below with image.
- Point the Fibonacci 100% on higher high of RSI 50.
- And place the Fibo 0% level on lower low of RSI 50.
- Now wait for Market to Retrace for 50% Fibonacci Levels with a Continuation Of RSI Below 50.
- Once this condition happen, the market means us it is in sell trend. So we should be ready to make a sell in the market.
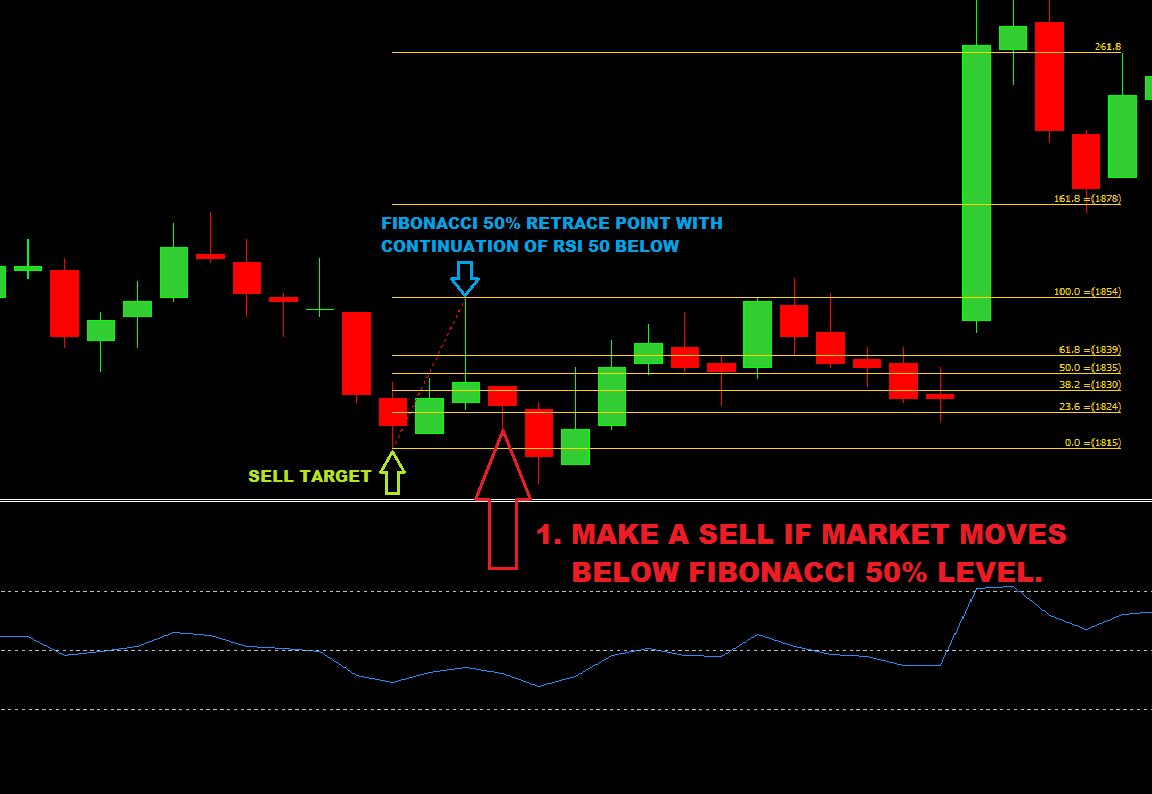
- The question here is where to make a sell? Kindly watch Image 2 given below to know the answer.
Image 1 : Shows the Basics of where to draw a Fibonacci retracement levels
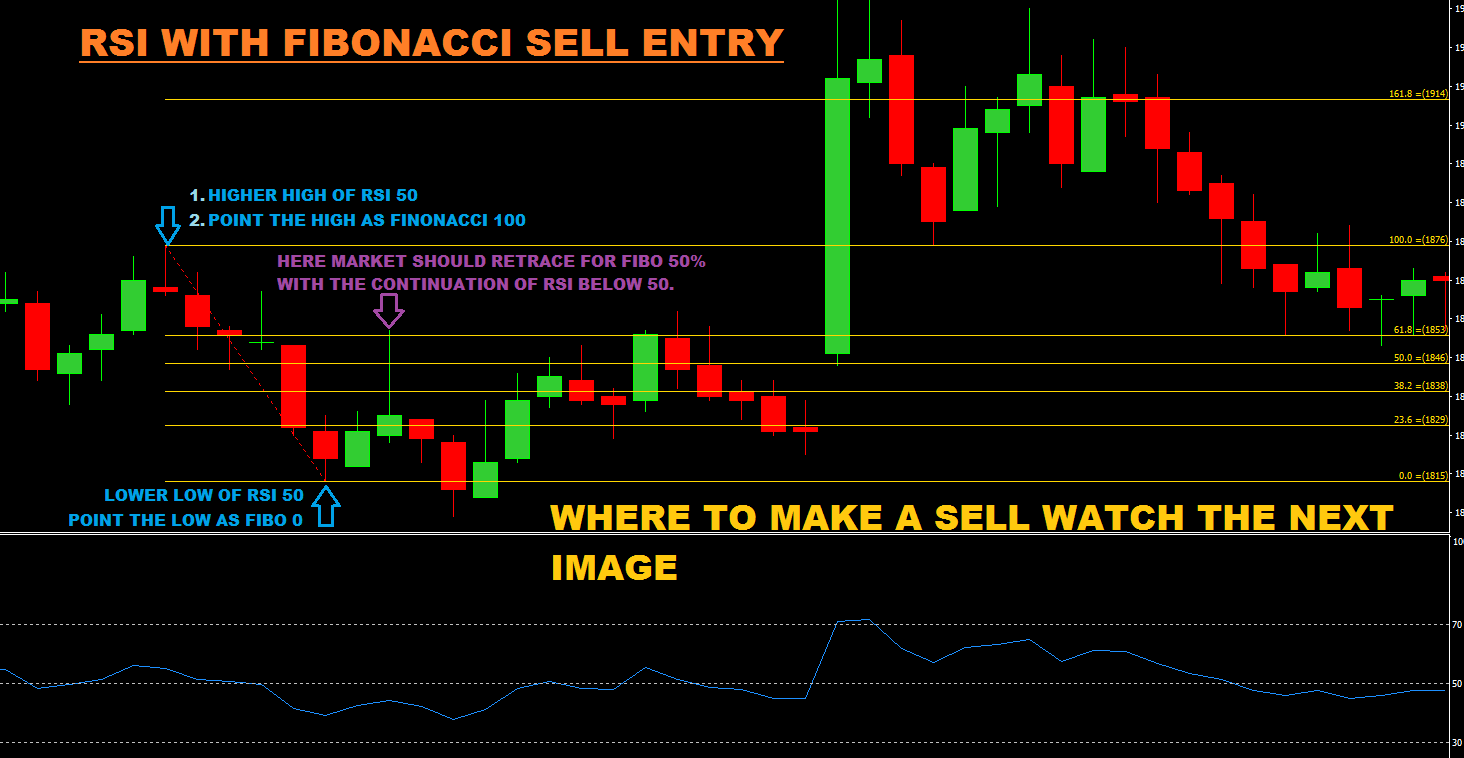
Image 2 : Shows the Basics of where to make a SELL Entry
- Now replace the Fibonacci 100% from top to Fibo 50% retracement high.
- Make a SELL if market Cross the Fibonacci 50% Level. Mean make a sell If Market Cross 1835 price.
Conclusion of Fibonacci Retracement Chart Levels
Finally we are in the conclusion of the article. Now let’s see what we covered in the above article. We covered of how to Create Strategy Using Fibonacci retracement levels in Tamil. How to use Fibonacci retracement levels? likewise Best time frame for Fibonacci retracement. If you like to know about the Fibonacci retracement YouTube video can visit the YouTube channel. As a result of the above article now the traders could know Fibonacci retrace meaning and intraday trading using Fibonacci retracement points.
Would you like to know about how to trade with Fibonacci retracement and extensions? Read this article it will help you. There are some common words in Fibonacci. Fibonacci retracement numbers, Fibonacci retracement chart. Similarly Fibonacci retracement golden ratio and Fibonacci series are almost the same words. This above words comes under the answer of 50% retracement levels. Finally we are in the Conclusion, about Fibonacci Retracement Strategy By Golden Ratio fibo Levels Fibo Numbers On Chart in tamil. all the best to make a profitable Fibonacci futures trading & Fibonacci stock trading.
RSI-BEST INTRADAY INDICATOR EXPLAINED TO MAKE PROFIT IN STOCK & COMMODITY IN TAMIL & ENGLISH
The RSI (relative strength index) is the momentum indicator that read the magnitude of recent traded price changes to index the upper circuit overbought & lower circuit over sold. The default value of RSI is 14 period in parameter & 70 as overbought area and 30 as oversold areas. The traders use the Rsi indicator for different purpose for intraday trading with different parameter settings. Like the most common parameters used in RSI is 80 as overbought and 20 as oversold. The traders make a sell once the price reached the overbought area 80 & make a buy once the price touch the oversold area 20. But here we are going to see a Real Secret of Using Rsi Indicator in Tamil (video) and in English.
RSI Trading Strategy For Intraday In Tamil
For Intraday Rsi Trading Strategy in Tamil Kindly Visit our YouTube Channel Chidhucommodity
This blog of content are about to explain what is mean by Rsi Indicator & How to use RSI indicator to make or earn a real profit in stock market. As said in above the Rsi default value are 14 Period and 70 as overbought & 30 as oversold. The people making a wrong decision by making a sell at overbought and making a Buy at oversold. The real method of using RSI intraday indicators is we should not make a Buy at Oversold (30) and we should not make a Sell at Overbought (70) Region. Actually we should look forward to buy at Overbought (70) & should look forward to make a Sell at Oversold (30) area. Kindly follow our titles below to Know More about Rsi indicator.
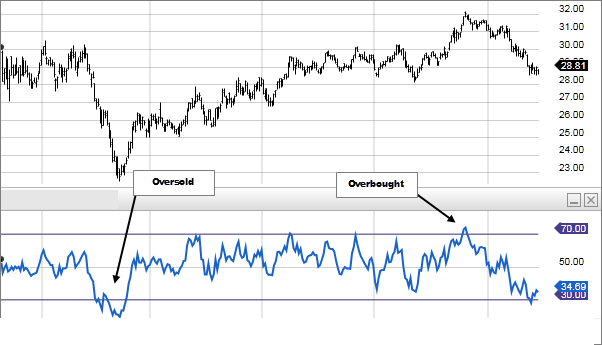
RSI Overbought & Oversold Meaning in Tamil
The very simple Logic, if price reached the 70 range it is a meaning of Overbought & if price reached the 30 range it s a meaning of oversold. For Tamil version of overbought & oversold meaning visit the secrets of Rsi.
The above image well explains us the real movement of Rsi Indicator. Many traders use the Rsi Overbought and Oversold in Wrong way. If Rsi reached the overbought (70) area it mean the market is in positive mode & if Rsi reached the oversold (30) area it mean the market is in negative mode. But the traders understand the Rsi in inverse method. They buy at (30) and Sell at (70).
Rsi Divergence & Convergence Indicator in Tamil
Rsi Divergence and Convergence method are most followed method by most of the traders. Soon we will update about a RSI Divergence & Convergence indicator trading method in Tamil in our YouTube channel.
Rsi Divergence:

Rsi divergence are very simple to understand. Look at the image above the Rsi Value are Decrease in value and and market price are increase in value. It mean market are trying to create a strong down fall movement. Once the breakout happen in Price the fall will happen.
Rsi Convergence:
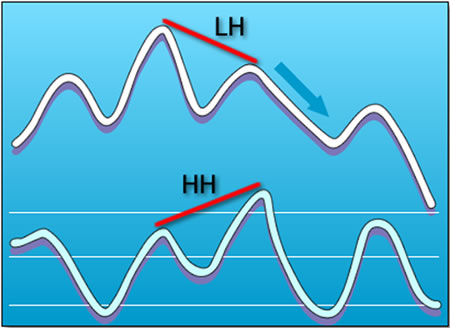
The RSI convergence is simple forward of Rsi divergence. Here in RSI convergence the price make a higher Low and the Rsi Make a Higher high. what it comes to mean is the change of trend could happen in that following script.
RSI Intraday Indicator Explained In Tamil
As said in above title for RSI Intraday Indicator in Tamil Visit our Channel (or) can view the video of content in Tamil by clicking the RSI Intraday Indicator Explained in Tamil Link.
I personally use RSI trading indicator for last 5 years in stock market, commodity market and in Forex market. In the following view of content I will explain of how to use Rsi indicator in Tamil, how to earn using Rsi in Tamil, how to get profit using Rsi in Tamil, how to make profit using Rsi in Tamil, how to earn money using Rsi in Tamil, how to use Rsi in stock market in Tamil, how to use Rsi in day trading in Tamil, how to use Rsi for swing trading in Tamil, how to use Rsi divergence in Tamil, how to use Rsi index in Tamil, how to use Rsi in trading in Tamil and will explain many more about the Secret of RSI (relative strength index).
Secret of Using RSI Intraday Trading Indicator in Tamil
Since we are from Tamil Nadu we post most of the video by Tamil Language. Soon we will post a RSI Secret Method in Tamil and English.
Follow This Secret:
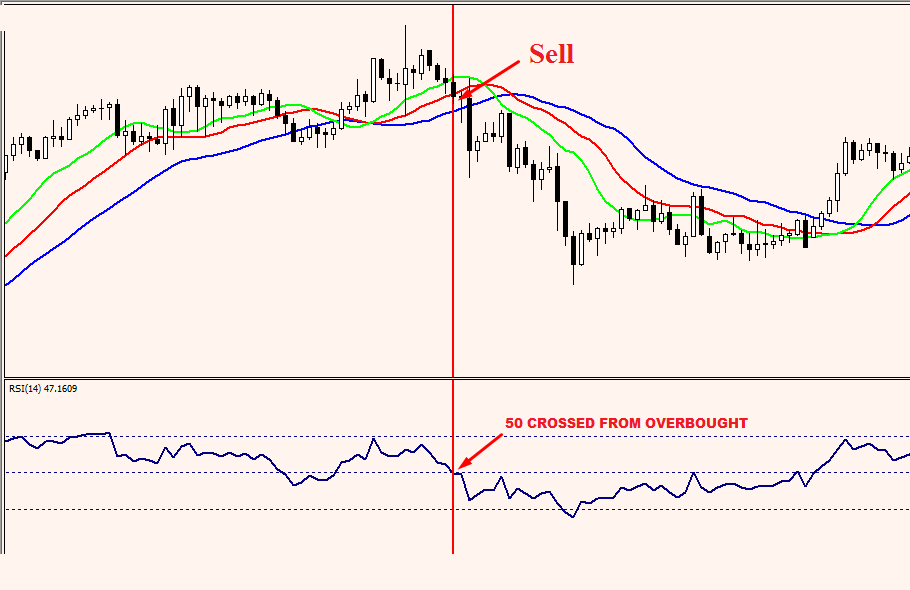
Rsi main secret is the 50 cross level. If Rsi crossed from overbought to Below 50 It mean the market might go downside (or) it means a fall could happen from above. If Rsi crossed from oversold to above 50 range it mean us the market might move upside from the price of fall. So always concentrate to use the Rsi only above the 50 cross range. Hope this explanation explains you about the Rsi divergence & convergence and many more about to make a profit using Rsi in swing trading.
Welcome To Chidhucommodity

Welcome to chidhucommodity
Question : What we Do ?
Answer : We Provide a Tips For Nse Future Market in India, We Teach a Trading Strategy for Mcx Crudeoil in India from tamil Nadu & We Provide a Forex Training From India.
Question : Do You Provide Any Free Guide About the Future Market ?
Answer : We Own a YouTube Channel Chidhucommodity. Can Learn more about the market movement and Watch of how we handle the movement of market In Tamil and English.
Question : Do You Provide Any Free Trail For Nse Market ?
Answer : Yes We Provide only of 4 to 5 trading tips in a month to trade in Nse Future Market. We Provide 1 Free Trail Tips in a Month to trade in Nse Future.
Question : How Can I Contact You ?
Answer : You can Contact Us Through our Mail Id : [email protected] , Mobile : +91 9003248345
90% Accuracy Forex Strategy Live Trading
RS.30,000 PROFIT MADE WITH SMALL STOPLOSS
Be Patience Learn the Movement


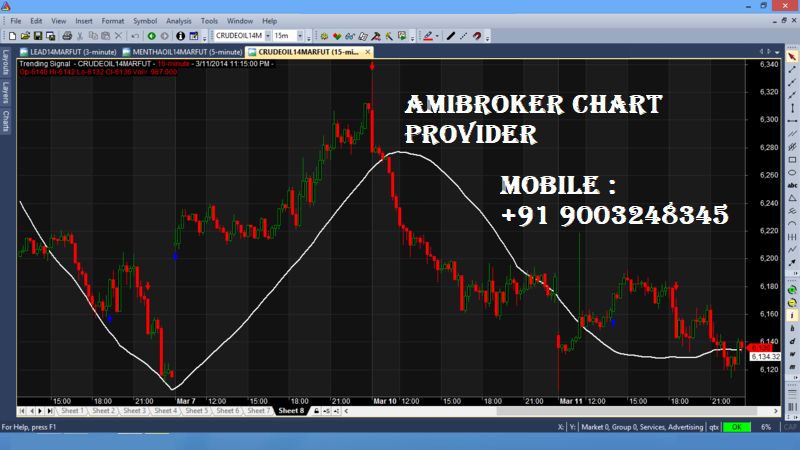
Amibroker Data Chart in Tamil Nadu
Amibroker Data Chart in Tamil Nadu
We are the best Amibroker chart provider in Tamil nadu for mcx commodity & Nse cash future. Meanwhile before trying the Amibroker chart try our mt4 demo chart. We provide 7 days Mcx commodity & NSE future stock demo for Amibroker.
Know The Rules To Trade The Indicators
Welcome To Chidhucommodity Blog
We Provide a Right Technical Knowledge About the Mcx Crudeoil, Nse stock and future market & Forex Market In India From Tamil Nadu.